Top 10 Biometric Identification Systems for Global Buyers
Choosing among the Top 10 Biometric Identification Systems for Global Buyers requires more than comparing prices and feature lists. A fingerprint scanner may perform well in a clean office, yet struggle with dust, moisture, gloves, or worn fingerprints. Facial recognition can shorten queues, but lighting, camera placement, and user consent strongly influence results. Iris systems may offer high accuracy, although installation and user acceptance can be more demanding. Real deployments are rarely perfect.
This guide examines Biometric Identification solutions through practical procurement criteria, including accuracy, liveness detection, enrollment speed, interoperability, data protection, and total operating cost. It also considers support quality, audit records, accessibility, and integration with access control or workforce platforms. Buyers should review independent testing, vendor documentation, and relevant standards before making a decision. ISO/IEC 30107-3 testing can help assess presentation attack detection, while privacy and security controls require careful local review.
No ranking fits every market. A system suitable for a hospital may not suit a border facility, warehouse, or university campus. That difference matters. Vendors should explain how biometric templates are stored, encrypted, retained, and deleted. They should also provide clear procedures for failed matches and manual review. Those details often reveal more than a polished demonstration.
Some product information changes quickly. Performance claims may depend on controlled conditions. Treat them as evidence, not promises. The strongest choice balances reliable identification, responsible governance, realistic field conditions, and long-term service support. Mistakes can happen. Good procurement plans anticipate them.
Biometric Identification Explained: Six Modalities and Global Buyer Needs
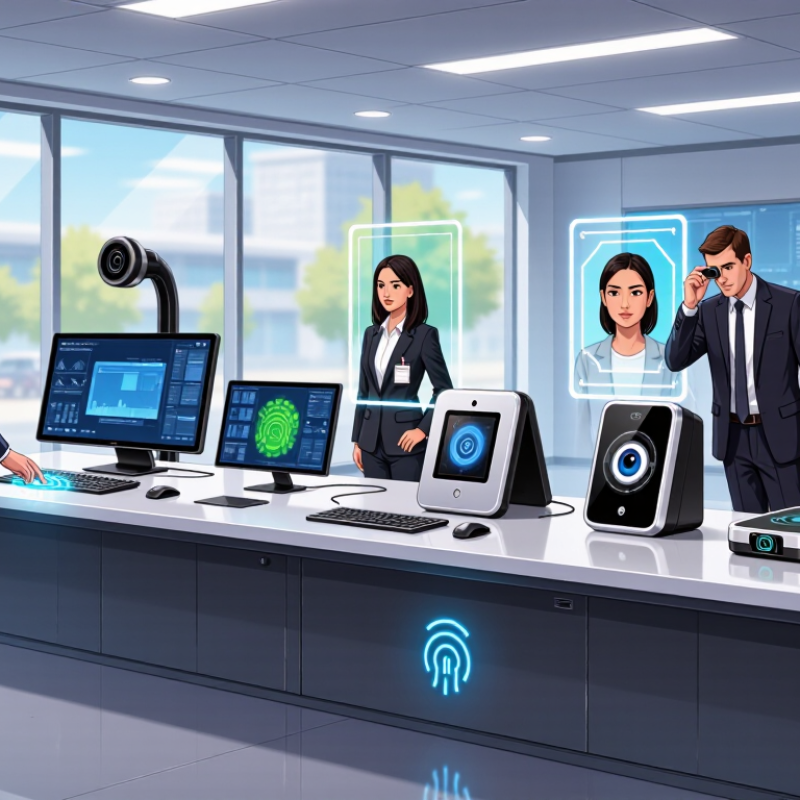
Biometric identification now spans six common modalities: fingerprint, facial, iris, voice, vein, and behavioral patterns.
Each reads a different human signal. Fingerprints suit door readers and attendance terminals. Facial systems support fast, contactless entry, even when users wear gloves.
Iris recognition can perform well at controlled distances. Voice works remotely, but microphones, accents, and illness can reduce reliability.
Vein patterns add strong liveness potential, although sensors cost more. Behavioral signals, such as typing rhythm, support continuous checks but may change under stress.
Buyer decisions should follow the environment, not marketing claims.
NIST’s Face Recognition Technology Evaluation has reported false-match differences exceeding 100-fold across demographic groups in some algorithms. That figure deserves serious testing, not a footnote.
NIST SP 800-63B also treats biometrics as something that should support an authenticator, rather than act as a secret alone.
Procurement teams should request independent accuracy results, presentation-attack testing, failure-to-enroll rates, and performance under poor lighting or noisy audio.
Privacy design matters from the first site survey.
ISO/IEC 24745 recommends protecting biometric information through controlled storage, unlinkability, and revocation planning.
A buyer should ask where templates are processed, how long they remain, and what happens after withdrawal.
The choice is rarely perfect. A fingerprint reader may fail with wet hands. Facial capture may struggle behind tinted glasses.
Pilot testing with real users often reveals uncomfortable gaps that laboratory figures hide.
Rank the Top 10 with NIST FRVT FMR, FNMR, and 1:1 Accuracy Metrics
For global buyers, the strongest biometric identification systems should be ranked through measurable performance, not attractive dashboards. NIST FRVT results provide a useful technical reference, especially for 1:1 verification. The key metrics are false match rate, false non-match rate, and accuracy. FMR measures incorrect acceptance. FNMR measures rejected genuine users. Lower is generally better.
A practical top-ten ranking should compare results at matching thresholds, not isolated accuracy claims. A system may show excellent 1:1 accuracy while performing differently in large-scale 1:N identification. Buyers should inspect image quality, demographic groups, search speed, and threshold settings. A camera at a bright airport entrance behaves differently from one near a dim warehouse door. Small details matter.
NIST testing does not equal a complete purchasing decision. It evaluates algorithms under controlled conditions, while deployment includes enrollment, privacy controls, device reliability, and operator training. A vendor-neutral review should record the tested version and submission date. Performance can change after updates. The ranking may also favor laboratory conditions. That deserves scrutiny. Real users move, blink, wear glasses, and present inconsistent lighting. A careful buyer should request independent trials using representative images, then compare FMR and FNMR at the same operating point. Accuracy alone can hide costly errors.
Assess Spoof Resistance Using ISO/IEC 30107-3 APCER and BPCER
Top 10 Biometric Identification Systems for Global Buyers
Spoof resistance deserves more attention than headline accuracy. ISO/IEC 30107-3 defines APCER and BPCER for presentation attack detection testing. APCER measures the percentage of attack attempts accepted as genuine. BPCER measures genuine users incorrectly rejected as attacks. Lower values are better, but they often move in opposite directions.
Buyers should request test conditions, not only a single score. A laboratory may test printed faces, replayed video, silicone masks, or altered fingerprints. Each attack type can produce different results. NISTIR 8280 evaluated 82 facial presentation attack detection algorithms from 45 developers. Its findings show that attack difficulty and operating conditions strongly influence performance. NIST’s Face Recognition Vendor Test reports also demonstrate that image quality can affect error rates substantially.
A practical review should record APCER and BPCER at the same operating point. Ask whether testing used ISO/IEC 30107-3 procedures, independent laboratories, and representative lighting. Test a phone screen under bright office light, then repeat it outdoors. Small details matter. Camera distance matters too.
Do not accept “liveness detected” as technical evidence. Request confidence intervals, attack categories, sample counts, and failure analysis. A low APCER with an unacceptable BPCER may frustrate legitimate users. A low BPCER with weak spoof resistance creates a different risk. I would also question unusually perfect results; real environments are messier than test rooms. Reports from the International Organization for Standardization and NIST provide useful frameworks, but buyers still need local validation before deployment.
Compare Throughput, Latency, Uptime, Integration, and Total Cost of Ownership
Top 10 Biometric Identification Systems for Global Buyers
Compare Throughput, Latency, Uptime, Integration, and Total Cost of Ownership
A serious comparison starts with measured performance, not brochure claims. Test each system with different lighting, camera angles, skin tones, and network conditions. Throughput shows how many users the system processes per minute. Latency reveals the waiting time at one checkpoint. A two-second delay feels minor until hundreds of people arrive together.
Uptime needs practical evidence. Request service records, maintenance logs, and recovery times after a power or network failure. A system may advertise 99.99% availability, yet local outages can expose weak backup design. Test offline operation with a busy entrance, dim lighting, and a temporary server disconnect. Small details matter.
Integration can decide the real project cost. Review application programming interfaces, identity databases, access devices, audit trails, and support for existing security workflows. Poor documentation often creates weeks of extra engineering work. Total cost of ownership includes licenses, sensors, storage, training, maintenance, upgrades, and replacement cycles. Cheap deployment can become expensive by year three.
Use a weighted scorecard, but question the weights. A warehouse may prioritize throughput, while a clinic may value accuracy and uptime more. Independent testing improves trust. Still, no ranking stays perfect across every environment. Real conditions are messy, and laboratory results sometimes flatter the equipment.
Top 10 Biometric Identification Systems for Global Buyers
Comparison of throughput, latency, uptime, integration effort, and five-year total cost of ownership.
| Deployment Profile |
Throughput
(matches/sec) |
Median Latency
(ms) |
Target Uptime |
Integration
(weeks) |
5-Year TCO
(USD) |
| Edge Fingerprint Matching | 1,200 | 80 | 99.99% | 3 | $180,000 |
| Cloud Fingerprint Matching | 300 | 300 | 99.90% | 4 | $240,000 |
| Edge Facial Recognition | 150 | 180 | 99.95% | 6 | $320,000 |
| Cloud Facial Recognition | 75 | 450 | 99.90% | 5 | $290,000 |
| Mobile Facial Verification | 40 | 500 | 99.50% | 3 | $210,000 |
| Iris Recognition Platform | 80 | 250 | 99.95% | 8 | $410,000 |
| Voice Biometric Platform | 200 | 350 | 99.90% | 8 | $380,000 |
| Palm-Vein Recognition | 60 | 300 | 99.90% | 10 | $450,000 |
| Edge Multimodal Matching | 90 | 220 | 99.95% | 12 | $650,000 |
| Hybrid Multimodal Matching | 180 | 160 | 99.99% | 14 | $780,000 |
These reference benchmarks represent typical enterprise deployment profiles. Throughput is measured in successful matches per second, latency is the median end-to-end response time, integration is estimated implementation effort, and TCO includes infrastructure, licensing, support, maintenance, and staffing over five years.
Match Systems to Border, Banking, Healthcare, and Enterprise Deployments
Top 10 Biometric Identification Systems for Global Buyers
Border deployments need fast matching, strong liveness detection, and reliable performance. National Institute of Standards and Technology testing has shown demographic error differences can exceed tenfold in some face recognition evaluations. Buyers should request subgroup accuracy, false-match rates, and failure-to-enroll data before deployment. A controlled airport pilot is useful, but one location cannot represent global traffic.
Banking systems require step-up verification, document matching, and secure remote onboarding. The World Bank’s ID4D research estimated that about 850 million people lacked official identification in 2017. This highlights the need for systems that support varied documents, weak connectivity, and assisted enrollment.
Healthcare requires a different balance. A bedside fingerprint or iris check must work quickly, while protecting sensitive patient records and preventing duplicate identities. Interoperability with existing hospital systems matters more than impressive laboratory accuracy.
Enterprise deployments often favor modular platforms with role-based access, audit logs, and flexible storage controls. ISO/IEC 30107 guidance makes presentation-attack detection a key evaluation area. Still, no ranking is universal. I would question any vendor claim using only one accuracy figure. Lighting, age, skin tone, injuries, and workflow pressure can change results. Buyers should compare ten systems through identical field tests, record failure cases, and involve privacy and clinical staff before scaling.